
Provides a list of Inventory/Stock related reports available in Back Office. To access, select the Reports option in the Inventory menu in Back Office, to open the Reports screen. Then expand any one of the Inventory or Inventory Quick Reports options listed on the left-hand side of the screen, to view the list of Inventory/Stock reports.
Subjects ▲ ▼
About ▲ ▼
What Is New? ▲ ▼
In Swiftpos:
- Period Location by Product Group (INV018)
- This report has been enhanced in Swiftpos v10.78.28+, v10.79.6+ and v10.80+ to provide more consistent inventory, cost and gross profit reporting. Particularly for Venues using Draw From Locations and reciped items/products.
Key enhancements include:
- Draw-from transfers and Net Cost of Goods now more accurately reflect the Location where stock is held.
- Recipe ingredient costs are consolidated against the parent item/product when Show Detail is enabled, providing clearer item/product-level cost and margin reporting.
- GP% is now calculated using the actual cost recorded against each sale.
- Opening Stock is correctly sourced from the first selected period when reporting across a period range.
- Write Off/On Variance totals have been improved to align with the report detail.
- Closed-period Draw From Transfer values are now reported more consistently.
-
These changes will be most noticeable at Venues using recipe items/products across Locations with draw-from inventory configuration. Venues where each Location holds its own stock, or where recipe items/products are not used, should see little or no change.
-
Historical reporting - The enhancement does not rewrite historical stock movements already stored in the database. Reports covering periods containing earlier affected movements may therefore continue to show the previous figures. New movements posted, and periods rolled up after upgrading will use the enhanced reporting logic.
- The enhancements made can be grouped as follows:
- Incorrect Stock Movements No Longer Generated
-
Draw From is now resolved from the parent item's setting, which is the value that actually governs where stock is held. Draw From Transfers and Net Cost of Goods now reflect only real stock movement.
-
Also, all totals have been corrected and reflect the sum of the details reported. This will be of interest to Venues using Draw From inventory, as well as recipes/family items/products.
-
- Cost And GP Calculation Re-worked
-
GP% is now calculated from actual cost of sales. It now uses the cost recorded against each sale line. GP% amounts will change at detail, subtotal and total level.
-
Ingredient cost now rolls up to the parent item/product. In detail mode, a child's ingredient Net Cost of Goods is aggregated onto its parent item/product at the stockholding Location, apportioned by recipe quantity. Child ingredient lines will now show $0.00 Net Cost of Goods, with the parent line carrying the total of the children. Write Off/On Variances roll up the same way. This rollup behaviour only applies when the Show Detail option is selected. Summary reporting is not affected.
-
Cost at non-stockholding Locations moves to the stockholding Location. A Location that draws its stock from elsewhere no longer carries its own Net Cost of Goods; that cost is attributed to the Location holding the stock. The drawing Location retains only its Transfers and Draw From Transfers values.
-
Opening Stock across a period range. When reporting a range of periods with an open period, Opening Stock now comes from the first selected period rather than the last. The new behaviour is the correct one for a range.
-
Draw From Transfers for closed periods now reads the stored Draw From value rather than deriving it from Transfer In/Transfer Out costs.
-
-
The Report may run slower as a result of the changes. This will be noticeable when the Show Detail option is selected, or there are large hierarchies of reciped items/products.
- Incorrect Stock Movements No Longer Generated
- This report has been enhanced in Swiftpos v10.78.28+, v10.79.6+ and v10.80+ to provide more consistent inventory, cost and gross profit reporting. Particularly for Venues using Draw From Locations and reciped items/products.
Reports ▲ ▼
Inventory Reports ▲ ▼
|
Back Order Report |
INV001 |
|
Reports on those Stock items that are on order grouped by Product Group. Lists the Product Group, Product, Size, Case Qty, Location #, Minimum, Maximum and the Qty On Order. This report can be sorted by Product Code or Description. |
|
INV038 |
|
Reports on Calculated Stock on Hand (SOH) values as at the start and end of a selected period, as well as stock movements. Lists the Location, SOH as at the start of the selected period, Purchases, Transfers In/Out, Sales, Other Stk Movements, Stocktake, SOH as at the end of the selected period, Current Cost, SOH Value as at the end of the selected period. In addition, the detailed versions lists:
With Advanced Host Integration registration this report can be filtered using:
|
|
|
INV005 |
|
Reports on all Inventoried items/products and provides a count field for the manual entry of Stocktake counts. This report can be sorted by Product Code or Description. This report can be grouped by Product Group. |
|
|
INV004 |
|
Reports on items/products that have had stock movements backdated prior to a stocktake during the selected period. Details are grouped by Location. Lists the Location, Product, Transaction Type, Reference, Qty, Transaction Date/Time, Stocktake Date/Time and SQL Post Date/Time. |
|
|
INV014 |
|
Reports on Stock Transfers grouped by the Location. Lists the From/To Location, Qty Out, Cost Out, Qty In and Cost In. This report can be sorted by Product Code or Description. In addition, the detailed version lists the items/products. |
|
|
INV015 |
|
To be continued ... grouped by Location and then Product Group. Lists Location, Product Group, Product, Opening/Closing Stock values, Stock On Hand, Cost of Sales and Turnover Ratio. This report can be sorted by Product Code or Description. |
|
|
INV037 |
|
Reports on Stocktake Variance for a selected Venue and groups them by Product Groups. Lists Product Group, Total Variance and then the Variance for the Locations in the selected Venue. The Variance can be reported in either Quantity or Value. This report can be sorted by Product Code, PLU or Description. In addition, the detailed version lists the item/product and Size. |
|
|
INV016 |
|
Reports on the current value of Stock on Hand grouped by Product Group. Lists the Product Group, Product, Size, Location, Unit Cost, Stock On Hand, Total Cost, Sale Value and Gross Profit %. This report can be sorted by Product Code or Description. |
|
|
INV002 |
|
Reports on all Stock Movements. Lists Product, Transacted Date, Posted Date, Clerk/Staff Member, Reference, Movement Type, Location, Cost and Qty. This report has 2 levels of sorting available. Sorting can be done by Transaction Date, Posting Date, Product Description, Product Code, Movement Type or Reference. In addition, the detailed version lists the Retail Value of the Stock movements based on the Location's default Price Level at the time the report is run. |
|
|
INV036 |
|
Reports on all Stock Movements (excluding sales) grouped by Location. Lists the Location, Product, Entry (Movement) Type, Qty, Cost and Value. This report can be sorted by Product Code, Product Description or Movement Type. This report can be grouped by either Location or item/product. |
|
|
INV017 |
|
Reports on all Non-Inventoried items/products (including Non-Diminishing Products) grouped by Product Group. Lists the Product Group and Price. This report can be sorted by Product Code or Description. In addition, the detailed version lists the items/products. |
|
|
INV011 |
|
Reports on Overstocked or Understocked items/products. Lists Location, Product, Case Qty, Stock on Order, SOH, Min/Max Qty and Re-order Qty Min/Max. This report can be sorted by Product Code or Description. |
|
|
INV018 |
|
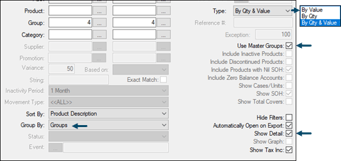
Refer HERE for more information. Reports on Stock Opening/Closing and Stock Movement values for a selected Opening Stock Period range. The report can be grouped by Location, Product Group or Master Group. It also can be generated to report using Quantities, $ Values or both. This can be achieved by selecting the appropriate Type option. When grouping either by Product Group or Master Group, the report can also be generated in Detail level. The report lists the Location, Product Group or Master Group, Opening Stock, Purchases, Transfers, Draw From Transfers, Closing Stock, Net Cost of Goods, Sales, Rebates, Stocktake Variances and Write Off/On Variances. Noteworthy Opening Stock - Qty and/or Value of the SOH as at the start of the selected Period. Purchases - Qty and/or Value of items/products purchased in the selected period Transfers - Qty and/or Value of items/products transferred between Locations in the selected period Draw From Transfers - Qty and/or Value of items/products sold with a different Draw From Location. Closing Stock - Qty and/or Value of the SOH as at the end of the selected Period. Net Cost of Goods - Opening Stock + Purchases + Transfers + Draw From Transfers) - Closing Stock calculated using either the Qty and/or Value.
Sales - Qty and/or Value of items/products sold in the selected Period. GP % - Gross Profit as a percentage. Rebates - Qty and/or Value of Rebates on the items/products sold in the selected Period. Stocktake Variance - Qty and/or Value of the difference between the Expected Stock and the Counted Stock. Write Off/On Variances - Qty and/or Value of Receipts + Adjustments + Damaged Stock + Returns + Wastage + Promotions. % Shrink - Value of Write Off/On Variances as a % of the Cost of Goods.
For Venues that MAKE USE of Trading Periods run the Period Location Audit (SLA042) report to check for sales mistakenly processed outside of the selected Trading Period range. For Venues that DO NOT make use of Trading Periods run the Calculated SOH by Location (INV038) report as a guide. |
|
|
INV019 |
|
Reports the Pricing Levels of items/products for each Location grouped by Product Group. Lists the Product Group, Product, Location, Stock On Hand, Cost, Prev Cost, Price Levels 1 - 10. This report can be sorted by Product Code or Description. |
|
|
INV020 |
|
Reports on all reciped items/products grouped by Product Group and Recipe Item. Lists the Product Group, the Recipe Item Product, the Recipe Item Size, the Recipe Item PLU #. Then it lists the Parent Item's Product, Qty, the Parent Product size, average cost per item and % of Cost. This report can be sorted by Product Code or Description. |
|
|
INV021 |
|
Similar to the Recipe Listing report, except it is grouped by Location, Product Group and Recipe Item. This report can be sorted by Product Code or Description. |
|
|
INV022 |
|
Similar to the Recipe Listing report, except it lists the Parent Items grouped by Product Group and which Reciped Items they are used in. Lists Product Group, the Parent Product, the Recipe Item Product and Used Qty. This report can be sorted by Product Code or Description. |
|
|
INV023 |
|
Reports the items/products to be Re-Ordered grouped by Supplier. Lists the Supplier, Product, the Supplier's Product Code, Qty Last 7 Days, Qty Last 28 Days, Min Qty, Max Qty, On Order, On Hand, Case Qty, Reorder Qty and Value at Cost. The value at Cost is based on the Supplier's Last Cost. This report can be sorted by Product Code or Description. This report can be grouped by Product Group. |
|
|
INV024 |
|
Reports on items/products that need to be transferred between 2 Locations to ensure the SOH levels of Products in the To Location are replenished to their maximum level. Selecting in the Reports screen, the Add to Batch option, this will ensure that not only is a report generated, but also a Batch Transfer is created with all the same items/products and their replenishment Qtys (Cases and/or Units) are included, to easily facilitate the transfer of stock to achieve the replenishment of SOH levels. Items/Products listed in the Batch Transfer, can of course be changed and committed at a later time. The report can be filtered by Location, item/product, Group and Category. It can be run as a Batch Report via the EOD process and create a Batch Transfer (using the Add to Batch option). This would then enable Bottle Shop or Cellar staff to prepare the restocking of stock levels for the Bar Staff. The report can only be run for one Location at a Time. For the main Stock Holding Location (Bottle Shop or Cellar) run the Inventory Forecast report to evaluate the predicted time left for current SOH. Then run the Purchase Order Wizard to create Supplier orders to replenish the stock levels in the main Stock Holding Location. How this is used in a typical Bottle Shop/Tavern scenario. ? Recall the Pending Batch Transfer, make any adjustments to the quantities as per availability of stock prior to committing the transfer. ? When an order is conducted the staff member responsible then simply has to order only for the main Location plus the odds and ends like kegs and post mixes that live in the bar stock stores. |
|
|
INV040 |
|
Reports on the items/products that have been Requisitioned (via Warehouse Requisitioning) and need to be picked. Lists the Requisition #, requesting Location, Date Required, Posting Date, Reference, From/To Locations. It also lists the Bin #, Qty, Product and Picked/Received checkboxes for each of the items/products to be picked and transferred. Lastly, it provides room for a signature and any handwritten comments. The second report (or last page) is used as a sign off sheet to confirm the items/products have been received and that the Transfer can be submitted. This report can be run from HERE. |
|
|
INV041 |
|
To be continued ... |
|
|
INV039 |
|
Reports on inventoried items/products and their Promo and Sales data, by either Product/Master Group and by Location, or just by either Product/Master Group. Lists the Location, Product/Master Group, Product, Size, Supplier, SOH (Stock on Hand), Promo, Savings, Qty, Cost, Sales, GP $ and GP %. |
|
|
INV044 |
|
Reports on inventoried items/products and their Promotions and Sales data, by either Product/Master Group and by Location, or just by either Product/Master Group. Lists the Location, Product/Master Group, Product, Size, Supplier Code, Case Qty, SOH (Stock on Hand), Promo (Ex/Inc), Savings (Ex/Inc) and Qty. |
|
|
INV025 |
|
Reports the status of all inventoried items/products grouped by Product Group. Lists Product Group, Product, Date Last Sold, On Order Qty, Stock On Hand, Min/Max Levels and Post Stocktake Inventory. This report can be sorted by Product Code or Description. |
|
|
INV026 |
|
Similar to the Status Report report, except it is grouped by Location. Lists Location, Product Group, Product, Date Last Sold, On Order Qty, Stock On Hand, Min/Max Levels and Post Stocktake Inventory. This report can be sorted by Product Code or Description. |
|
|
INV027 |
|
Reports all items/products by Primary Supplier. Lists Supplier, Product, Case Qty, Stock On Hand and Stock on Hand in Cases/Units. |
|
|
INV028 |
|
Reports the Locations that have had a Stocktake in the selected period. Lists the Lists Location, the Clerk/Staff Member # and Name, the Posting Date/Time and the Reference. |
|
|
INV013 |
|
Reports the Stocktake Variance Quantity and Value per Product Group and grouped by Location. Lists the Location, Product Group, Variance Qty and Value (based on the Cost price). This report can be sorted by Product Code or Description. This report can be grouped by Location or Product Group. |
|
|
INV012 |
|
Reports the Stocktake Variance per Product Group and grouped by Location. Lists the Location, Product Group, Variance Qty and Value (based on the Cost price). This report can be sorted by Product Code or Description. This report can be grouped by Location or Product Group. |
|
|
INV042 |
|
Reports the Stocktake Variance and percentage either by Master Group or Product Group and then by Location and Venue. Lists the Venue, Location, Master Group/Product Group, SOH Value, Variance value and percentage. |
|
|
INV029 |
|
Reports on Stock Transfers grouped by Location, Transfer From/To and then Product Group. Lists the Location, Transfer From/To, Product Group, Qty, Cost Out/In and Date Transferred as well as the Reference. This report can be sorted by Product Code or Description. In addition, the detailed version lists the items/products. |
|
|
INV030 |
|
Reports on the value of Stock Transfers by Location. Lists the Location and Value (based on the Cost price at the time of the Transfer). This report includes Transfers in Swiftpos Back Office and at the POS. |
|
|
INV031 |
|
Reports on Stock Transfers grouped by Location and then Transfer From/To. Lists the Location, Transfer From/To, Qty, Cost Out/In (based on the Cost price at the time of the Transfer) and Date Transferred as well as the Reference. This report can be sorted by Product Code or Description. |
|
|
INV032 |
|
Similar to the Transfers by Product report, except it is for 2 Locations. |
|
|
INV033 |
|
Reports on the current Stock on Hand (SOH) and Value grouped by Location and summarised by either Product Group or Master Group. |
|
|
INV034 |
|
Reports on the current Stock on Hand (SOH), Cost and Sale Value, and Gross Profit values grouped by either Location, Product Group or Master Group. By Location - Lists the Location, SOH, Total Cost, Sale Value and Gross Profit %. This report can be sorted by Product Code or Description. In addition, the detailed version lists the items/products and size. By Product Group - Lists the Product Group, SOH, Total Cost, Sale Value and Gross Profit %. This report can be sorted by Product Code or Description. In addition, the detailed version lists the items/products and size. By Master Group - Lists the Master Group, SOH, Total Cost, Sale Value and Gross Profit %. This report can be sorted by Product Code or Description. In addition, the detailed version lists the items/products and size. |
|
|
INV035 |
|
Similar to the Value by Location report, except it deducts the Stock that is associated with Tables that are currently open (not finalised). |
|
|
INV043 |
|
Reports the Wastage information grouped by Reason Code and then Location and Venue. Lists the Reason, Venue, Location, Qty, Cost and Retail Value. |
|
|
STRF001 |
|
Reports on the items/products that have been selected for Transfer via the Batch Transfer screen. Lists the Trading Date, Reference, From/To Locations, Qty, Cost, Product and PDE Scan Date. This report can be run from HERE. |
|
|
STRF003 |
|
Reports on the items/products that have been identified to be picked for Transfer via the Batch Transfer screen. The report consists of 2 reports. Each report for each of the From/To Locations. The first report (first page at a minimum) lists the Posting Date, Reference, From/To Locations. It also lists the Bin #, Qty, Product and Picked/Received checkboxes for each of the items/products to be picked and transferred. Lastly, it provides room for a signature and any handwritten comments. The second report (or last page) is used as a sign off sheet to confirm the items/products have been received and that the Transfer can be submitted. This report can be run from HERE. |



Inventory Quick Reports ▲ ▼
Select from the Reports available and then configure the filters/options specific to the selected report.
Filters/Options ▲ ▼
-
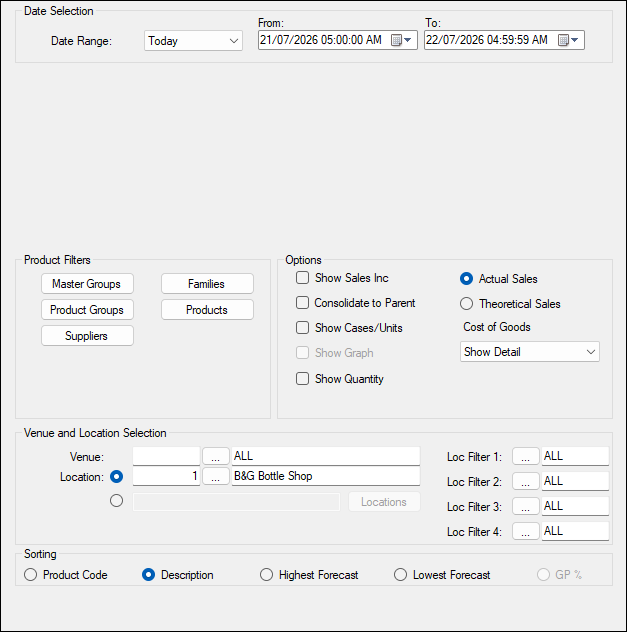
Date Selection - Nearly all of the reports in Swiftpos can be filtered by a date range. The date range can either be selected from the drop-down list of Periods or entered manually.
- Product Filters - Select from the filters available. The filters available will depend on the Report selected.
- Options - Select from the options available. The options available will depend on the Report selected.
- Venue and Location Selection - Select from the Venue and Location related filters.
- Sorting - Select from the options available.
Reports ▲ ▼
|
Cost of Goods |
QIH014 |
|
Use the Period Location Summary Report for more accurate reporting in Trading Periods. Reports opening/closing Stock values and Actual Cost of Sales grouped by Product Group and Location. Lists Location, Product Group, Products, Opening Stock value, Nett Transfers, Nett Purchases, Closing Stock, Closing Mix, Actual Cost of Sales, Discount, Sales value, Sales Mix, Stocktake Variance, Wastage/Adjustment, Gross Profit %, Gross Profit Mix %. Values can be reported as $ values or quantities. This report can be sorted by Product Code/PLU or Description. The opening and closing values for this report are also generated using the end of day option as is with a number of other reports in this section. In addition, the detail version of this report lists the items/products. |
|
QIH004 |
|
Reports on the quantity/value of Inventory/Stock Damaged in the previous 6 months grouped by Product Group. Lists the Product Group. Items/Products and the values of the Damages over the previous 6 months from the From date specified in the filters. |
|
|
QIH003 |
|
Reports on the quantity/value of Inventory/Stock Adjustments in the previous 6 months grouped by Product Group. Lists the Product Group. Products and the values of the Adjustments over the previous 6 months from the From date specified in the filters. |
|
|
QIH013 |
|
Reports on the calculated Forecast in Weeks and Days the current SOH will last per item/product. The report uses the number of items sold per items/product in the Period selected and compares the sales to the current SOH level and calculates the Forecast values. Lists the Product PLU and Description, Supplier Code, Case Qty, Size, Cost of Sales, Qty, Sales (Excl./Incl. Tax), Gross Profit %, Stock on Hand (SOH), Location Cost, Value of SOH and the Forecast in Weeks and Days. |
|
|
QIH001 |
|
Reports on the quantity/value of Inventory/Stock Movements in the previous 6 months grouped by Product Group. Lists the Product Group. Items/Products and the values of the Movements over the previous 6 months from the From date specified in the filters. |
|
|
QIH006 |
|
Reports on the quantities/value of Inventory/Stock Promotions in the previous 6 months grouped by Product Group. Lists the Product Group. Items/Products and the values of the Promotions over the previous 6 months from the From date specified in the filters. |
|
|
QIH005 |
|
Reports on Stock Purchases summarised by Calendar month (for each of the 6 months prior to the To Date selected) and grouped by Product Group. Lists the Product Group, Product and Sales value per month, plus a total. |
|
|
QIH007 |
|
Reports on the quantity/value of Inventory/Stock Receipted in the previous 6 months grouped by Product Group. Lists the Product Group. Items/Products and the values of the Receipts over the previous 6 months from the From date specified in the filters. |
|
|
QIH008 |
|
|
|
|
QIH009 |
|
Reports on the quantity/value of Inventory/Stock Returned in the previous 6 months grouped by Product Group. Lists the Product Group. Items/Products and the values of the Returns over the previous 6 months from the From date specified in the filters. |
|
|
QIH011 |
|
Reports on the quantity/value of Inventory/Stock Wasted in the previous 6 months grouped by Product Group. Lists the Product Group. Items/Products and the values of the Wastage over the previous 6 months from the From date specified in the filters. |
|
|
QIH012 |
|
Use the Period Location Summary Report for more accurate reporting on Trading Periods. Reports on Inventory/Stock Movements grouped by Product and then Product Group. Lists the Product Group # and Description, Product Code, PLU and Description. Location #, Opening Stock, Sales, Adjustment, Damaged, Promotion, Wastage, Nett Purchases, Nett Transfers, Stocktake Variance and Closing Stock. This report can be sorted by PLU # or Product Description. |
|
|
QIH002 |
|
Reports on Stock Variance ($ value or quantity) monthly totals for the 6 months leading up to the date selected, grouped by Product Group. Lists the Product Group, Product, Month total for each of the 6 months and the Total. This report can be sorted by PLU, Description or Product Group. |
|
|
QIH010 |
|
Reports on only those Inventory/Stock Transferred that resulted in a Cost Variance grouped by Product Group. That is, the difference in the cost value of the goods transferred between the From and To Locations. This generally will only occur when the Product's Cost Price differs between Locations. Lists the Product Group. Items/Products and the values of the Variances over the previous 6 months from the From date specified in the filters. Also reports the Total value of Variances. |
Stocktake Reports ▲ ▼
Venues
End of article ▲